Thursday, December 9, 2010

Canada: King Jack

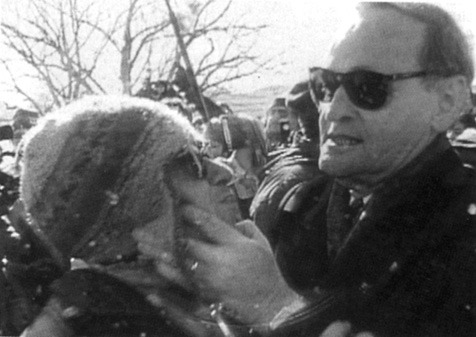
Jack LaytonImage by mattjiggins via Flickr
Of the several ways that Jack Layton is very truly Ed Broadbent's heir, one of the most obvious is that he is personally much more popular than his party. One wonders if this is not a prerequisite for leading the NDP (or, thinking of Carole James, Darrell Dexter and Bob Rae, among others I should say a prerequisite for leading the federal NDP). One almost wonders if people don't compensate for not supporting the NDP by tossing their leader a few bones.

The extent, though, is almost comical. Angus Reid does this kind of stuff best. In addition to simple 'approval/disapproval' questions, they also ask what characteristics best describe the four main pary leaders (Elizabeth May is not included, for one reason or another). On this particular front, Layton has always performed well, but Angus Reid has new numbers and they're even better than usual. I thought it would be interesting to quantify just how well.

A random example of these numbers might be 'open' (as opposed to 'secretive'). Harper, Duceppe and Ignatieff are seen as 'open' by 8%, 9% and 10% respectively of the public polled by Angus Reid. Layton, on the other hand, is seen as 'open' by fully 29% of the public. 29% is not a stellar number, but it's more than the other three combined. You might not believe that that was a random selection, but let me put it this way: of the nine positive traits on Angus Reid's poll (down-to-earth, open, efficient, compassionate, honest, strong, exciting, in-touch, and intelligent), Layton scores better than the other three on every one except 'efficient' and 'strong' (in both cases, he comes second behind Harper). Of the nine negatives, primarily opposites to the positives (arrogant, secretive, inefficient, uncaring, dishonest, weak, boring, out-of-touch, foolish), Layton gets the best scores (obviously, the lowest percentages in these cases) on every one except 'weak', where he is beaten by both Harper and Duceppe.

Putting these numbers into action, I decided to add together the 'negative trait' values of each of the leaders and then the 'positive trait' totals. The numbers are interesting.

Stephen Harper's total negative-characteristic score is 258. That means that the total of the percentages of people who attributed each of those nine negative values listed above to Harper is 258 - his number is highest, which doesn't mean he's the least-liked leader, merely the one the most people have an opinion on. Ignatieff comes next with 245, quite near to Harper. Duceppe's negative values total 178, though I should mention that Angus Reid only asks about Duceppe in Québec. Nationwide this number would presumably be higher. Jack Layton leads the pack with 121, which is less than half of Harper and Ignatieff's numbers.

Looking at those nine positive traits, Ignatieff can muster only a meagre 82 points across them. Considering that that's the total of nine different percentages, that's a lousy number. 'Intelligent' is the only thing that a decent number of Canadians have positive to say about Ignatieff, and even at that Harper and Layton beat him (Ignatieff's numbers are bottom of the pack in every other positive trait: only one in fifty Canadians, for example, describes him as 'exciting'). Duceppe gets an also-weak total of 105. Harper may have the largest negative total, but his positive total is high too - 146 points, reflecting again the fact that more people have opinions about him (one way or another) than the other three. Still though, Layton pulls far ahead with 215 points. The average Canadian can find almost three good things to say about Layton for every one good thing they can find to say about Ignatieff.

If you subtract the negative totals from the positive totals, the results are striking: Ignatieff fails miserably, with a total of -163. Harper does only a little better, with -112. Duceppe remains in the negative, with -73, but Layton not only has a net positive rating, but quite a decent one: +94. That's an amazing difference, really. By this particular measure, Layton is head-and-shoulders above the competition.

It's arguable how much that actually means: Ipsos Reid also has numbers out that show Harper leading the competition on the question of 'who would make the best prime minister': 43% say Harper, 33% say Layton and 24% say Ignatieff. It's tough to be sure how to analyse that, except to say that Canadians like Layton more than they actually want him to be prime minister. That's an awkward position for Layton to be in, but all in all these polls clearly look good for him. Especially if he ignores polls that discuss voting intent.
Enhanced by Zemanta

Tuesday, December 7, 2010

Ontario and Other Kingmakers

So there's a belief that you come across every now and then that Ontario determined federal elections; that what Ontario wants, Ontario gets. Historically, this claim has most often been made in connection to so-called 'Western Alienation', the feeling that the Western provinces are left outside the halls of power. In fact, as often as not that claim is made not merely of Ontario but of Ontario and Québec in combination as 'Central Canada' or the whole of the country east of Manitoba as 'Eastern Canada'. As those geographic blocs, however, form a majority of seats in parliament, I'm not sure how meaningful it is to talk about them dominating politics. To take my point to an extreme, if someone from the North complained that 'the provinces' held too much power, they would by any definition be factually right, but it would be tough to argue it as a failing of democracy.

Breaking the country into four blocs - the West, Ontario, Québec, and the Atlantic - is practical as the four contituent parts each hold a large amount of seats (at present 92, 106, 75 and 32 respectively), and as they're each terms with historical merit ('The West' is the most nebulous term, really, consisting of four provinces each with very distinct voting trends, but when totalled, trends do emerge).

In this exercise, I've gone back to Diefenbaker's 1958 landslide, and in each case I've looked at the total number of seats per party returned in each of the four regions, and I've also considered what Parliament would look like if it were composed of the whole country minus the region in particular. In other words, a "minus-Ontario" result would be the combined seat totals for the West, for Québec and for the Atlantic (the North as well - in each case I include the North's three seats in relevant national totals, but otherwise ignore them); as if Ontario had seceded from the union prior to the election.

The point of this math is to consider scenarios where the actual government formed by the election in question (which party, and whether it was a majority or a minority) differed from the "-Ontario" result; if removing Ontario from the equation would produce a different government than actually occurred.

The overview results are interesting themselves: In 17 elections, the nation as a whole has returned 6 Liberal majorities and 4 Liberal minorities, 3 PC majorities and 2 PC minorities, and two Conservative majorities. So Liberal domination, but a relatively healthy bipartisan mix. Looking at the regions, though, shows quite a difference: the Atlantic considered alone returned 9 PC majorities, 8 of them straight, between 1958 and 1984; after that, they switched teams decisively, electing 7 liberal majorities, interrupted by their only plurality: the surprising result in 1997 when the Atlantic returned a plurality of PC MPs.

Québec looks similar. Though they went PC for Diefenbaker and Mulroney (being largely responsible for Canada's only two near-consensuses in recent history), otherwise it was Liberal pre-Mulroney (7 straight majorities, one plurality) and BQ post-Mulroney (6 straight majorities). The West, despite an amazing volatility in BC and intermittently strong NDP results in Saskatchewan and Manitoba, have been remarkably consistent in their affections. Trudeaumania took over BC in 1968 enough to return a Liberal plurality, but otherwise it's been non-stop PC majorities from 1958 to 1988, non-stop Reform/CA/Conservative majorities since.

That leaves Ontario, which perhaps is the Bellwether, based on how consistent the other three regions have been. Ontario has returned 11 Liberal majorities, 2 PC majorities, 2 PC pluralities and 1 Conservative plurality.

Overall, the West has swayed the winning party on three occasions (1962, 1979 and 2006), while Ontario has done so on three occasions (1979, 1997 and 2004), and Québec on four occasions (1963, 1965, 1972 and 1980 - remarkably a Québec-less Canada would have returned the PCs every year from 1958 to 1988 except in 1968). The Atlantic since 1958 have not once swayed an election.

Looking down the years, then:
  • In 1958, Diefenbaker won a decisive majority. Each region gave a majority of seats to the PCs, so obviously each 'minus parliament' also did so. It's interesting that while the Liberals tend to be 'Canada's natural governing party', the only true landslide sea-to-sea consensuses we've seen have both been PC.
  • 1962 brought a PC minority, the first of three minorities. The coasts stayed majority-PC, while Ontario returned a Liberal majority and Québec a Liberal plurality. 1962 definitely shows that the 'Central Canada' thesis has holes in it: Ontario and the Atlantic had no affect, while Québec held the PCs to a minority (a minus-Québec parliament would have returned a PC majority) and the West actually chose the PM (a minus-West parliament would have been Liberal minority).
  • 1963, though, shifts the numbers just enough to prove the West's point: a Liberal minority brought about by the coasts returning majority PC MPs and the 'centre' returning Liberal majorities. But the minus-numbers tell an interesting story. Again, Ontario and the Atlantic had no effect, while the West this time kept the Liberals to a minority and Québec turned the tides, from a PC minority to a Liberal one.
  • 1965 was another Liberal minority, and everything I've said for 1963 applies here too, except that a minus-Atlantic parliament would have been an even split: 116 Liberals to 116 'others'. I think technically that's a Liberal minority, but I'm not entirely sure how to classify it.
  • 1968 is Trudeau's big year, and a Liberal majority. It's interesting to note, looking back, that Trudeau's party-poopers were not the West so much as the Atlantic. The West brought a threadbare Liberal minority, while the Atlantic decisively stuck with favourite son Robert Stanfield, giving his PCs 25 in 32 seats. 'Central Canada', of course, went deep red. This was a Liberal majority, and no single region could have changed it from a Liberal majority.
  • Trudeau won 1972 too, but by two seats. The Atlantic kept its PC majority, the West returned to a PC majority (never again to waver), and Ontario went to a PC plurality. Thus, it seems like 1972 was Québec's year, with their decisive Liberal majority keeping Trudeau at 24 Sussex. And indeed, Ontario and the Atlantic had no effect, while the West held Trudeau to a majority, and a minus-Québec parliament would have been a PC majority.
  • In 1974, Trudeau got his majority back, and the numbers are similar, just shifted in the Liberals' favour. PC majorities in the West and Atlantic, Liberal majorities in Québec and Ontario, and the notion that 'Central Canada' runs the country quite firmly established by now. This is certainly the case in 1974, with neither the West nor the Atlantic having any sway, with Ontario enough to shift it from a Liberal minority to a Liberal majority, and with Québec's vote enough to move from a PC minority to a Liberal majority.
  • 1979's PC minority was interesting. This time out Ontario joined the West and the Atlantic in returning PC majorities, while Québec returned another Liberal majority. Only the Atlantic had no sway this time: were it not for the West, the PC minority would have been a Liberal majority. Were it not for Ontario, the PC minority would have been a Liberal minority. And were it not for Québec, the PC minority would have been a decisive majority. No wonder the government was doomed to failure.
  • 1980 brought Trudeau decisively back, with another Liberal majority. With the West returning only two Liberals and Québec only one PC (PC majority and Liberal majority respectively), it increasingly looks like Ontario really is the kingmaker, its fickle preferences dictating results when the West and Québec are so decisive in their support for their 'home teams'. In fact, both it and the Atlantic 9for the first time) went Liberal-majority. Only Québec can lay claim to holding sway, though, as minus-parliaments for the other three regions still return Liberal majorities, while a minus-Québec again brings a PC minority.
  • 1984 is our second landslide, with Mulroney's PCs gaining a majority in each region (in each province and territory, in fact) and reducing the Liberals to 40 seats. There's little to say here - electing Mulroney was a nation-wide effort, and no individual region could have stemmed that tide (or wanted to, as it transpired).
  • 1988 was another PC majority, but less decisively. Ontario gave the PCs only a plurality, while the Atlantic returned a Liberal majority. With the West handing the NDP their best-ever result (while still going PC-majority, though), it seems like Mulroney had Québec to thank, proving that after years of kingmaking for the Liberals, La Belle Province could play kingmaker for the PCs too. Interesting, then, that after this election Québec will decisively turn away from affecting federal outcomes, remaining by and large on opposition benches henceforth. As it turns out, though, no single region kept Mulroney in power. A minus-Québec would have still been PC, but minority, while the other three regions had no effect.
  • 1993, of course, is where everything changed. I imagine most Canadians old enough to remember could tell you that Ontario and the Atlantic sent decisive Liberal majorities, while the West sent a Reform majority and Québec a BQ majority. What all this means, though, is that ultimately not one region could be said to have turned this election, however it appears. A minus-West election and a minus-Québec election would have unsurprisingly returned Liberal majorities. So would have a minus-Atlantic parliament. A minus-Ontario parliament would have returned a minority, but the Liberals would still have won it.
  • 1997 was perhaps even more interesting. The only regional overall change from 1993 was that the Atlantic went plurality-PC (thus each of the four regions preferred a different party). Like last time, neither the West nor Québec nor the Atlantic could have prevented a Liberal majority, but this time the majority was all Ontario's - two-thirds of Chrétien's MPs were from Ontario. A minus-Ontario parliament would have returned, of all things, a Reform minority. But it would have been almost completely dysfunctional, with 60 Reform MPs, 54 Liberals, 44 Bloquistes, 21 New Democrats and 19 PCs. God know what kind of bills, if any, that parliament could pass.
  • 2000 was 1993 again: Liberal majorities in Ontario and the Atlantic, a barebones BQ majority in Québec, and another majority for the Party-Formerly-Known-as-Reform in the West. A Liberal majority, that without Ontario would have been a minority, but otherwise no region could have changed.
  • The Liberals won in 2004 too, if a minority mandate can truly be called 'winning' and 'merely not losing'. The regions once again still look the same, though that western party is now called the Conservatives. Neither Québec nor the Atlantic could have swayed a Liberal minority, but but for the West it would have been a Liberal majority, and but for Ontario it would have been a Conservative minority. As indeed it was about to be.
  • 2006 brought Harper's Conservatives a minority, elected through regional majorities: the BQ in Québec, the Liberals in Ontario and the Atlantic, and the CPC in the West. So while all four regions have returned the exact same results in each of the previous three elections, the result has shifted from Liberal majority to Liberal minority to Conservative minority. And quite clearly the West were kingmakers this time, as no other region could have prevented a Conservative minority, but a minus-West parliament would have been another Liberal minority.
  • By 2008, the Conservatives had been able, with a pickaxe, to slowly pick away at Liberal support in Ontario to the point that this time out they'd tipped the balance - a CPC plurality in Ontario. The other three regions have stuck with their favourites for the sixth time in a row (excepting the Atlantic in 1997) though, suggesting again that Ontario is where elections are made and broken. In fact, though, we have Québec to thank for the current government makeup. None of the West, Ontario or the Atlantic could have changed a CPC minority, but were it not for Québec, Harper would have had his long-dreamed-of majority.

What to do with all this information? Well, what it shows me is that the West is more of a kingmaker than Westerners might think but that ultimately Québec wields the most power - especially before the birth of the BQ. It's also interesting to see just how little power the Atlantic actually have. Unsurprising, perhaps, in terms of overall numbers, but seeing how independent-minded they can be, still unexpected.
Enhanced by Zemanta

Monday, November 8, 2010

The Progressives: A Further Fiction

Just playing around with the Uniform Swin model Excel file that you can download at the Paulitics blog.

I decided to try using the current projection at ThreeHundredEight, which is to say the current regional voting estimates. The Paulitics model crunches the numbers differently than ThreeHundredEight does, though, since the same numbers give pretty different results. The Paulitics model gives us:
  • Conservatives: 129
  • Liberals: 88
  • NDP: 36
  • Bloc Québécois: 52
  • Green: 0
  • Others: 3
It's a bit odd to see three 'others' seats, and I guess it's a problem with the model that it lumps all 'others' data together. Still, interesting numbers, that produce the same kind of result as any other poll or poll ananlysis out there: Conservative minority.

But that's just the starting point. I then decided to look at the numbers for my 'progressives' fiction, wherein the NDP, the Greens and the Bloc united, without shedding any support. In other words, I combined the current vote for the NDP and Green Parties, putting the combined total into the NDP box, for all of Canada except Québec, where I combined the total of the three and put that total in the BQ box. What did that give us?
  • Conservatives: 113
  • 'Progressives': 110
  • Liberals: 82
  • Others: 3
Interesting numbers. And interesting in that 'Progressive' gains would come pretty much completely at the expense of the Conservatives - the Liberals would stay more or less constant. The regional seat-by-seat breakdown would be as follows:
  • BC: Prog 15, CPC 14, Libs 7
  • Alberta: CPC 25, Prog 2, Other 1
  • Prairies: CPC 20, Prog 5, Libs 3
  • Ontario: CPC: 44, Libs 41, Prog 21
  • Québec: Prog 61, Libs 12, CPC 1, Other 1
  • Atlantic: Libs 18, CPC 9, Prog 4, Other 1
  • North: Prog 2, Libs 1
I don't know how reliable these numbers are, but they're intriguing. BC, where the Greens are not an insignificant party, gets its numbers rearranged dramatically. Much of the rest of the country doesn't, however. I'm surprised to see the 'Progressives' so low in Atlantic Canada, for example.

This particular parliament would be pretty darn unworkable, wouldn't it? Or rather it would put a lot of power into the hands of the Liberals. It actually resembles the UK political dynamic.

But let's take it further: let's imagie that a united Progressive party would be enough to win over one in ten current CPC supporters and one in five current Liberal supporters. What then?

Well, we still wouldn't be in majority territory. There might be something off about my calculations, but now I get:
  • BC: Prog 22, CPC 10, Libs 4
  • Alberta: CPC 25, Prog 2, Other 1
  • Prairies: CPC 17, Prog 9, Libs 2
  • Ontario: CPC 46, Libs 30, Prog 30
  • Québec: Prog 65, Libs 8, CPC 1, Other 1
  • Atlantic: Libs 13, CPC 10, Prog 8, Other 1
  • North: Prog 2, Libs 1
For a grand total of:

  • Progressives: 138
  • Conservatives: 109
  • Liberals: 58
  • Other: 3
A minority, but a significantly stronger minority than the one we currently have. Interesting that my 'step one' ate away at the Conservatives more than the Liberals but that my 'step two' has decimated the Liberals. Highly interesting (though not implausible) that my 'step two' actually increases the Conservatives' seats in Ontario. And interesting that despite all this number crunching (combining three parties and taking a significant chunk from the remaining two), the Progressives not only don't get a majority nationwide but they also lag far behind everywhere except BC and Québec.

Strange numbers. Expect me to use the Paulitics model for other stuff too.

Saturday, October 30, 2010

Toronto: A Nascent Cycle

It's fine call Rob Ford the 64th Mayor of Toronto - it's true, and it shows just how old a city Toronto is, but it's rather more illustrative to call him the third mayor. The third mayor of the city as we know it today, that is. The third mayor, winner of the fifth election, of the city that was amalgamated in 1998 from a number of smaller municipalities. Given how much talk is being made at the moment about 'Old Toronto' vs. the 'inner suburbs', this seems like a valuable thing to bear in mind.

After all, how can you argue with this map, from the Toronto Star?


I think it's correct to frame this election as downtown vs. suburbs. Additionally, it was also about the role of government, about the power of populism, and to a limited extent about the traditional divisions of left, centre and right. It was about downtown vs. the suburbs, so people are right to talk in those terms. People are wrong, though, in pretending that there's anything new about that. It's kind of the way this city works, actually. And though five campaigns is obviously not enough to detect trends, there does seem to be a common thread among them.

The first post-amalgamation election was explicitly downtown vs. suburbs, pitting the incumbent mayor of (Old) Toronto, Barbara Hall, against the decades-long incumbent mayor of North York, Mel Lastman. While one needn't assume that everyone would root for the home team, and while it says nothing about how Etobicoke, York, East York or Scarborough would vote, the results seem oddly familiar:


Barbara Hall's narrow defeat is actually, interestingly, the only time so far an incumbent mayor has been defeated in post-amalgamation Toronto, and even at that it's a half-exception, since she was beaten by an incumbent too. The map above is not quite downtown vs. suburbs so much as north vs. south, but it's definitely a polar split, with the left-leaning candidate winning the vote in the most heavily concentrated urban core and the right-leaning candidate winning in the (slightly) sparser outlying areas.

It's not accurate, however, to say merely 'that's the dynamic in Toronto'. After all, four years later Lastman was re-elected with such a landslide that they might as well have put a crown on his head. Lastman served two terms as mayor of what was once called Metro Toronto, and left on a high note. He didn't seek re-election in 2003, an election which came down to David Miller on the left and John Tory on the right. The resultant map of the 2003 election?


This is admittedly not quite a map of 'old Toronto vs. the suburbs': three Scarborough wards went Miller, for example, and he won fully three wards bordering Steeles. But there is still a duality here, one remarkably similar to 1997... or similar to last week too. And it bears mentioning: not just 'inner' vs. 'outer' but also 'left' vs. 'right', with downtown on the left and the suburbs more likely to trend right.

Again though... just 2003. The next election in 2006 was much more decisively a victory for Miller, whose 57% of the vote was no Lastman-style coronation but was even throughout the city: he won 42 of 44 wards. And did not seek re-election this time around.

What do we see? Well, a pendulum, one that swings every eight years, not four. We see that Toronto likes its incumbents regardless of traditional left/right or urban/suburban divides, but when not faced with an incumbent, resort to traditional, predictable trends. With a (official) lack of partisan branding, Toronto's municipal elections inevitably feature a wide variety of candidates but tend to coalesce around two major candidates, who are then distinguished as broadly 'left' and 'right'. Some of the parts of Toronto that just handed Ford a victory are among the most faithful Liberal seats both federally and provincially, so I would question the importance of the left/right divide, as we traditionally view it, in the current election. I think there's a lot to consider, in fact, in the current election, but if history tells us anything, the divides we feel in our city now will dissipate over the next four years. And if there really is a cycle in Toronto municipal politics, then four years from now cries of "Four More Years" will ring from Ford supporters all the way from Rexdale to Harbourfront. Stranger things have happened. Er... I think.


Enhanced by Zemanta

Wednesday, October 20, 2010

Canada: "The Progressives", a Fiction

A green maple leaf, recoloured from Image:Cons...Image via Wikipedia
So I'm looking at the newest EKOS numbers - they have a few extra parameters this week. I've been considering a particular fiction that crops up every now and then: the idea that more unity existed on the left side of the spectrum. I'm not talking about some grand coalition or merger between the Liberals and the NDP; considering the Liberals to be what Trudeau once called the 'radical middle', I consider the three mainstream parties that have left-of-centre platforms (regardless of the political alliegances of their supporters): the NDP, the Bloc Québécois and the Green Party.


Let's consider a particular fiction: that these three parties somehow merged and shed no support to other parties. Would it affect the political landscape? Wow, would it ever:

  • Nationwide, the Progressives have a slight lead over the Conservatives at 35.5% to 34.4%. The Liberals trail at 27.8%.
  • In BC, the Conservatives have a slight lead, at 40.9% to the Progressives' 38.7%. The Liberals are far behind at 16.3% (though British Columbians are to pollsters as Samoans are to anthropologists).
  • 'Fortress Alberta' remains firmly in Conservative hands with an amazing 61.8%. The Progressives and the Liberals are far behind at 19.9% and 15.0%.
  • The Prairies are also safe for the Conservatives, with 45.0%. The Progressives are in second at 30.7%, with the Liberals trailing at 20.2%.
  • Ontario is a tight race between the Conservatives at 37.8% and the Liberals at 37.3%. The Progressives trail at 23.8%.
  • 'Fortress Québec' remains firmly in Progressive hands, with a remarkable 59.8%. The Liberals and the Conservatives trail at 24.0% and 13.7% respectively.
  • Atlantic Canada has the Liberals out front at 37.0%, but it's a rather tight race, with the Progressives polling second at 33.7% and the Conservatives at third at 26.9%.
  • Urban centres look like the following:
    • Vancouver: CPC 43.6%, Prog 34.0%, Libs 16.5%
    • Calgary: CPC 57.6%, Libs 22.0%, Prog 16.0%
    • Toronto: Libs 44.4%, CPC 35.8%, Prog 17.9%
    • Ottawa: Libs 37.5%, CPC 35.0%, Prog 27.5%
    • Montréal: Prog 62.6%, Libs 27.2%, CPC 8.1%
  • The gender gap is strong.
    • Nationwide, the Conservatives lead among men at 40.0% to the Progressives' 32.4% and the Liberals' 25.8%.
    • Women, on the other hand, put the Progressives ahead at 38.6% with the Liberals in second at 29.9% and the Conservatives in third at 28.5%
  • Huge gaps surround age too.
    • Under 25s have the Progressives at 45.1 to the Liberals' and Conservatives' 26.5% and 25.4%.
    • The 25-44 age group also has the Progressives in the lead at 38.6%, but the Conservatives overtake the Liberals 31.8% to 27.1%.
    • In the 45-64 group, the Conservatives overtake the Progressives 36.3% to 34.8%. The Liberals trail at 26.7%.
    • In the 65+ group, the Conservatives are well in the lead at 41.8%. The Liberals pass the Progressives 32.4% to 24.1%.
  • Country of birth matters as well.
    • Canadian-born Canadians have the Progressives ahead at 38.0%, with the Conservatives at 32.8% and the Liberals in the basement at 26.2%.
    • Foreign-born Canadians put the Liberals in the lead, however, with 38.1% to the Conservatives' 31.4%. The Progressives trail at 27.8%.
  • Education also makes a significant difference.
    • People with no post-secondary education put the Conservatives and the Progressives almost exactly equal, at 38.3% and 38.0% respectively. The Liberals trail at 20.7%.
    • People with a college or CEGEP education are similar, though they push the Progressives ahead at 36.4% to the Conservatives' 34.5%. The Liberals again trail at 25.7%.
    • Among university grads, though, the split is effectively three-way, with the Liberals at a slight lead with 33.8% over 33.2% for the Progressives. The Conservatives keep it tight at 31.9%

Quite interesting, no? Considering it this way shows a rough three-way split nationwide but all kids of variation across demographics. Looking at these stats a little more graphically, in each case I'm forgetting the numbers and just looking at the one-two-three positions, colouring them blue for Conservatives,  red for Liberals and green for the theoretical Progressives:
  • #1, #2, #3: Nationwide
  • #1, #2, #3: BC
  • #1, #2, #3: Alberta
  • #1, #2, #3: Prairies
  • #1, #2, #3: Ontario
  • #1, #2, #3: Québec
  • #1, #2, #3: Atlantic
  • #1, #2, #3: Vancouver
  • #1, #2, #3: Calgary
  • #1, #2, #3: Toronto
  • #1, #2, #3: Ottawa
  • #1, #2, #3: Montréal
  • #1, #2, #3: Men
  • #1, #2, #3: Women
  • #1, #2, #3: Under 25
  • #1, #2, #3: 25-44 years old
  • #1, #2, #3: 45-64 years old
  • #1, #2, #3: 65+
  • #1, #2, #3: Canadian-born
  • #1, #2, #3: Foreign-born
  • #1, #2, #3: High school
  • #1, #2, #3: College / CEGEP
  • #1, #2, #3: University grads
Or, what is probably a better way to view this whole mess:

  • #1, #2, #3: Nationwide, 25-44 years old, Canadian-born, College / CEGEP
  • #1, #2, #3: BC, Alberta, Prairies, Vancouver, Men, 45-64 years old, High school
  • #1, #2, #3: Ontario, Calgary, Toronto, Ottawa, 65+, Foreign-born
  • #1, #2, #3: Québec, Montréal, Women, Under 25
  • #1, #2, #3: Atlantic, University grad
There is no demographic ranking Liberals first, Conservatives second and Progressives third.

Enhanced by Zemanta

Monday, October 18, 2010

Toronto: It's All in How You Look at It.

Icon from Nuvola icon theme for KDE 3.x.Image via Wikipedia
I wish I'd bought them today. All day long I couldn't help looking at Toronto Sun boxes and Toronto Star boxes as I passed by them. It was just too funny not to note. The big news was Angus Reid's poll showing Ford at 41% and Smitherman at 40%.


The Sun blared out something like "Rob rides the wave", commenting how the Angus Reid poll still had Ford out front. The Star, meanwhile, looked at the same data and decided they showed Smitherman and Ford 'neck-and-neck'. While both are technically true, it says a lot about how the media in Toronto has sacrificed any attempts at unbiased reporting.

Enhanced by Zemanta

Friday, October 15, 2010

Canada: One Loser, No Winners

So Nanos has some new numbers out.

Nothing spectacular about them - just corroboration of EKOS, both of whom see, surprisingly, a Conservative rise this week. But apart from the current numbers, what caught my eye was a chart tracking voting intentions all the way back to 2002. I'm not happy to cut-and-paste from another site, but the graph that I'm including here, for reference, comes directly from the link at the top of the page.


Interesting it certainly is. Looking across the chart from 2002 to present, the main thing you note is the terrible dive Liberal numbers have taken: from 49.0% to 32.9%, meaning fully one in three 2002 Liberals can now be found elsewhere.

But where exactly? While each of the other four parties has shown an increase in the interim, the increases are all mild: to the Liberals' -16.1% drop, we see relatively paltry gains of 1.6% for the Conservatives, 3.8% for the BQ, 6.3% for the NDP and 4.9% for the Greens, since they weren't even on the survey in 2002.

There are a few huge caveats to observe here: first, it's remarkable that in 2002, 35.0% of the country was willing to vote for a party that wouldn't exist for another year and a half. I have to presume that 35.0% was the combined total of the PC and CA numbers, rather dodgy science to be sure. And even if this is true, conventional wisdom has it that the redder Tories reacted badly to the merger, drifting to the Liberals or elsewhere. And yet the first major thing we see happening after December 2003 is not a drop in the blue line but a huge drop in the red line. What's that all about?

After all, after that drop, the Liberals are sitting at 37.0% - it had already shed 12.0 of the 16.1% it was due to drop, and the remainder is not all that significant, statistically. You might call it stasis since then.

If it is stasis, though, it's highly unstable. Based on unreality as those numbers may be, the left side of the graph shows a political scene Canadians are well familiar with - two clearly dominant parties with not-insignificant additional parties laying well below the others. Somewhere between bipartisan and multipartisan. That's still true when you look on the right side of the graph, perhaps, but it's much muddier. For a while now, the combined totals of the NDP, the BQ and the Green Party have surpassed or at least drawn even with the two 'ruling' parties. Not that that means anything except as an intriguing reading of the statistics, but parties are hardly 'fringe' when in combination the rival the 'majors'.

We've been here before. The merger of the PC and CA parties really was a game-changer, but it only brought back the appearance of a renewed bipartisanism. The 1990s were a strange time for Canadian politics. Chrétien's Liberals were able to get back-to-back majorities with as low as 38.46% of the vote. That bears consideration: Chrétien was able to secure a majority with just a percentage point or two more than Harper's Conservatives are currently polling.

The cure in 2003 was to 'unite the right'. The death of bipartisanism was dealt with by attempting to revive it. I'm sceptical of equivalent 'unite the left' talk at the moment, because the perception of unity the Liberals, the NDP, the BQ and the Greens appear to have (all parties are happy to admit that at the moment 'us vs. them' means Conservatives vs. everyone else) is little more than skin-deep. I think we need to have a discusison in Canada about the permanent death of bipartisanism, and how to overcome adversarial politics in a landscape where it's no longer feasable.

32.4% is an atrocious number for the party that has spent the majority of Canada's time as a nation as the government. 36.6% is a horrible number for the party currently controlling the government. But those are bad numbers only in the context of 'how we do things in Canada': in Germany in 2009, the CDU/CSU had a 'decisive' victory with only 33.8% of the vote, in Italy in 2008 Berlusconi comfortably won with 37.4%. Our closest parliamentary role model, the UK, just saw the Conservatives take power with 36.1%. This is how democracy works in modern western countries. Multipartisanism is the norm.

Within the Canadian context at the moment, the word 'coalition' is always assumed to mean a Liberal/NDP coalition. The is mostly based around the adversarial character of the Conservative Party at the moment: both that it suits their purposes to frighten people about the spectre of a 'coalition of losers' (perhaps with the BQ tossed in) and also that it's quite impossible to imagine the conservatives entering into a genuine power-sharing agreement with any of its opponents.

But that will have to change sooner or later. Harper is right when he says a coalition of parties that excludes the single party that earned the most votes lacks legitimacy. Globally there is increasingly a sense that in multipartisan democracies, the single party that gets the largest share of votes and/or seats has the right to attempt to form a viable coalition. For the sake of the maturity of our political system, I would welcome the idea of the Conservatives entering into formal coalition talks after the next election, provided they got the most votes.

A majority of Canadians, EKOS tells us, want a return to majority government. That might be all but impossible; what we need is to turn away from unstable minority governments. The unchecked power to follow an agenda as far as possible is a risk we might in the long-term be happy to avoid. But operating under the constant threat of, and the well-honed dread of, elections has caused out entire political system to coalesce around opinion polls. Never before have Ipsos, Angus Reid, EKOS and Nanos wielded so much power. Canada needs to enter into a discussion about how to learn to accept the idea of coalition.

On the other hand, though, at present the Conservatives would seemingly be unable to put together a stable coalition with any other party. What then? I suspect that the 2008 attempt by the Liberals, the NDP and the BQ to form a coaltion was so poorly recieved because it seemed undemocratic. Perhaps it was: but if the first party proves unable to put together a stable parliamentary majority, it should fall to other parties to attempt to do so. This would, I think, be the beginnings of a modern political system, one where a multitude of voices does not come at the price of an increase in instability, and one, hopefully, that can get over the destructive adversarial nature of Canadian politics at the moment.