Tuesday, June 22, 2010

Canada: The Provincial Scene, part 1

Nova Scotia New Democratic Party leader Darrel...Image via Wikipedia
Some notes on how things are looking at the polls province by province. I'll do a quick rundown of provincial polls across the country, from east to west, but I'll do it in two parts (I know, I know, I've said that before...). So to start with, I'm looking at the Atlantic provinces and Québec. Tune in, er, tomorrow-ish for the other six party-based sub-national entities.

Newfoundland and Labrador: One of five provinces going to the polls in 2011, Newfoundland still seems to be in the throes of Williams-mania. The premier managed to get his PC Party an amazing 69.6% of the vote in 2007, and three years in, CRA has his party's support at 75%. Liberals at 16% and NDP at 8% must be wondering at present if it's even worth campaigning.

Prince Edward Island: Going to the polls the same month as the other Island province, the traditionally bipartisan PEI seems happy with its incumbent Liberal premier Robert Ghiz, with CRA showing 61% of islanders planning to vote Liberal, up from the 53% who did in 2007. The main opposition, the PCs, have taken a hammering - from 41% in the last election to 27% today. The NDP at 8% must be pleased with that, since last time out they couldn't even manage 2% support, and came fourth behind the Greens, unchanged in three years at 3%.

Nova Scotia: NDP premier Darrell Dexter, the first NDP premier east of Ontario, might be pleased that there's still a maximum of four years till the next election: the two percent lead CRA shows him having over the Liberals, 37% to 35%, is no cause for celebration for a man who got 45.3% of the vote not one year ago and saw that number rise as kigh as 60% after the election. The PCs at 24% are keeping Nova Scotia genuinely tripartisan.

New Brunswick: It's worth noting that incumbent Liberal premier Shawn Graham actually got fewer votes in 2006 than the PC candidate: this can, of course, happen in First Past the Post democracies. Anyway, New Brunswick's is the nearest election, just a few months from now. Graham got a decent boost immediately after the election, when within two months the Liberals were polling an amazing 65% to the PCs' 27%. But it's been downhill ever since, with the decline gaining momentum. CRA shows them 5% behind the PCs, 37% to 42%, with the NDP trailing at 16% and the Greens polling at 5% despite being barely two years old.

Québec: The Parti Libéral took the December 2008 election by 7%, but pretty much every poll since then has shown them trailing the Parti Québécois. Léger Marketing at the moment has an 11-point difference, with premier Jean Charest's Libérals at 30% to the PQ's 41%. Les Verts at 5% and Québec Solidaire at 8% are both more than twice what they got in 2008, but the ADQ continue their freefall, with their current 13% support signalling a return to a basic bipartisanism in the province.
Enhanced by Zemanta

Thursday, June 17, 2010

Canada: The Great Divide

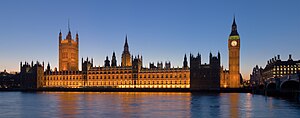
The Palace of Westminster at night as seen fro...Image via Wikipedia
Just looking at this week's EKOS report. Obviously nothing shockingly new. Obviously. Further Conservative drop, at 30.5 the only party above 30% and even at that, barely. Current trends suggest in a week or two we might find that we have no single party polling above the twenties. And with all the present talk about mergers or coalitions in the air, it seems the reality of this deadlock is starting to sink in. Although it's nothing new, i was taken by the fact that EKOS, and most pollsters, put five parties at above 10% or the vote. The current numbers, for reference:
  • Conservatives: 30.5%
  • Liberals: 26.3%
  • NDP: 17.4%
  • Green: 12.3%
  • BQ: 10.5%
  • Other: 3.0%
I got to wondering whether, among Canada's Westminster brethren, there was another example of such extreme dissipation of voter intent. If there was another place where the fifth most popular party still polled above ten percent. I chose to look at the most recent parliamentary elections. Obviously our coalition chatter has a lot to do with the UK precedent. What were the top five parties there?
  • Conservatives: 36.1%
  • Labour: 29.0%
  • Lib Dems: 23.0%
  • UKIP: 3.1%
  • BNP: 1.9%
1.9% is a long, long way from 10.5%. Australia?
  • Labor: 43.4%
  • Liberal: 36.3%
  • Greens: 7.8%
  • Nationals: 5.5%
  • Family First: 2.0% 
2.0% is actually high, because you might choose not to put the Nationals on this list, being a largely symbiotic party constantly allied with the Liberals (like the CSU in Bavaria). In that case, #5 is even lower: 0.8%. What about their neighbour New Zealand?
  • National: 44.9%
  • Labour: 34.0%
  • Green: 6.7%
  • ACT: 3.7%
  • Maori: 2.4%
Higher than the UK and Australia, but still less than a quarter of the BQ's support. Ireland? Note these are 'first preference' votes.
  • Fianna Fáil: 41.6%
  • Fine Gael: 27.3%
  • Labour: 10.1%
  • Sinn Féin: 6.9%
  • Green: 4.7%
That's way higher than what we've seen so far, but still very low. If the Jamaican general election Wikipedia page is to be believed, the 5th biggest party did not win a single vote in the whole country. Trinidad and Tobago doesn't even have five parties.

I made a point of looking at the South Asian Westminster democracies, since India, Pakistan and Bangladesh are famous for having loads of parties. And of course they do: but, like Israel and Italy, a large number of parties tends toward coalitions or 'alliances'. Somewhere along the way, Canada has become exceptional. It might well be true that Canada has the widest electoral divide among countries that still resist formal coalitions. None of the talk buzzing around Parliament Hill regarding the opposition parties strikes me as reliable or meaningful, but it would appear that there is a trend, particularly in Westminster systems, toward a smaller number of 'mainstream' electoral choices - be that through coalition or merger.

What that can mean for Canada, I can only speculate.

Enhanced by Zemanta

Thursday, June 3, 2010

Canada: Understanding BC

Coat of arms of British ColumbiaImage via Wikipedia
I realise I'm properly due a 'part two' on the youth vote. But I got stuck in regionalism, I guess... nah, I'll get back to it, hopefully in a day or two. I was just intrigued by something that I've been noticing in EKOS polls for weeks now, something that's being called to attention this week: the existence of a true and proper four-way race in BC. The current EKOS shows the following for BC voters' intentions:
  • Conservatives: 33.6% (1.9% above the national vote)
  • NDP: 26.9% (9.5% above the national vote)
  • Liberals: 19.8% (6.4% below the national vote)
  • Green: 16.8% (5.3% above the national vote)
  • Others: 2.9% (10.3% below the national vote)
A few things to consider: the BC 'other' vote is actually identical to the national 'other' vote: when I say there's a difference of 10.3%, that actually reflects BQ support, averaged across the whole nation. Accepting that the existence of a non-national party in Québec makes it more difficult to compare nationwide and provincial votes, we can still see that the NDP and Green poll much better in BC than in the rest of the nation, and the Liberals poll significantly lower. BC is actually the only part of the country where, above the margin of error, the Liberals are polling less than second-best. Intriguingly, the Vancouver numbers are practically identical to the province as a whole: I say 'intriguingly', because historically this has not always been true.

A heightened level of support for the NDP and a lowered level of support for the Liberals suggests a bipartisan system of 'left party' vs. 'right party', with the centrist party as a minor 'third party': a political playing ground that exists in a lot of places, but has tended not to exist in Canada. Looking back over BC's voting trends in recent federal elections, we can see this:
  • 2008: CPC 44.4%, NDP 25.0%, LPC 19.3%, Green 9.4%
  • 2006: CPC 37.3%, NDP 28.6%, LPC 27.6%, Green 5.3%
  • 2004: CPC 36.3%, LPC 28.6%, NDP 26.6%, Green 6.3%
  • 2000: CA 49.4%, LPC 27.7%, NDP 11.3%, PC 7.3%, Green 2.1%
  • 1997: Ref 43.1%, LPC 28.8%, NDP 18.2%, PC 6.2%, Green 2.0%
  • 1993: Ref 36.4%, LPC 28.1%, NDP 15.5%, PC 13.5%
  • 1988: NDP 37.0%, PC 35.3%, LPC 20.4%, Ref 4.8%
  • 1984: PC 46.6%, NDP 35.1%, LPC 16.4%
  • 1980: PC 41.5%, NDP 35.3%, LPC 22.2%
  • 1979: PC 44.3%, NDP 31.9%, LPC 23.0%
  • 1974: PC 41.9%, LPC 33.8%, NDP 23.0%
  • 1972: NDP 35.0%, PC 33.0%, LPC 28.9%
  • 1968: LPC: 41.8% NDP 32.6, PC 18.9%
An interesting picture, not nearly as clear as I'd thought it would be. Though we need to go all the way back to 1968 (42 years) to find the Liberals winning the province, whereas the Liberals have been in power nationwide for most of that time, they've spent longer as #2 than I'd figured. In fact, for the entire Reform/CA era, between the PC's collapse and the 'consolidation of the Right', the Liberals consistently came in #2 in BC. In other words, the splitting of the right-wing vote somehow consistently pushed the centrist Liberals above the left-wing NDP: which makes little sense on the surface.

Before that era and since it, I think we can truly see the makings of a bipartisan system in BC: in 1984, for example, the PC party and the NDP party between them took over 80% of the vote in BC. While there's certainly an element there of Western dislike of Trudeau and his energy policy, NDP support is more difficult to gauge, as they are equally interested in federal intervention in energy policy.

And dislike of Trudeau, and his party as a whole, does little to explain the extent to which, provincially, BC is even more polarised. Remarkably, you have to go back to 1937 to find an election where the NDP (or the CCF before them) polled lower than #2 in total number of votes: in fact, it was the success of the CCF that in 1945 caused the Liberal and Conservative parties to enter into a coalition in order to beat them: a bloc of anti-leftist support that arguably invented the left-right dynamic we see here. The coalition collapsed, and both parties were swept practically off the map by a new right-wing party called the Social Credit Party. By 1975, the SC and the NDP were capturing almost 90% of the total vote, making the Liberals and the PCs 'fringe' parties: at a time when their federal namesakes were the two main parties, nationwide.

What confuses the picture is the fact that, in BC, the Social Credit Party was ultimately replaced on the right by the BC Liberals. For most of the rest of the country, this makes little sense, but names do not tell the whole story: the BC Liberals are usually considered the main right-wing party in BC, and BC Liberal voters are by no means Liberal Party of Canada voters - in fact, there's a good chance they'll support the Conservative Party of Canada.

So if that's the case, how do things stand at the moment? Well, here's a recent provincial poll:
  • NDP: 44%
  • BC Liberals: 32%
  • Green: 13%
  • BC Conservatives: 7%
This is still extremely bipartisan, but less than it historically has been: 7% support for a party calling itself 'Conservatives' is unheard of since 1972 (though there has always been a small-c conservative party in either the government or in the opposition in BC).


Reblog this post [with Zemanta]